
Use case
Case Study: Gold Prospectivity - Val-d'Or, Québec
August 26, 2026
MinersAI applied its gold prospectivity model to Val-d'Or, Québec, integrating 20 datasets across structural, geophysical, and geochemical layers. Trained on a third of the district and tested across the full 6,600 km² area, the model recovered known gold systems along structurally prepared ground, validating its ability to generalize into unseen terrain.
The Region
The Val-d'Or district sits in the southern Abitibi Greenstone Belt, one of the most productive Archean gold provinces in the world, with more than 250 million ounces of gold across the broader belt. Val-d'Or is positioned along a major deflection in the Cadillac-Larder Lake deformation zone, a regional structure that has controlled gold mineralization across the southern Abitibi for billions of years.
The district is a strong demonstration ground for prospectivity modeling: the geology is structurally complex, public SIGEOM data coverage is deep, and the gold systems are well-characterized enough to test whether the model is learning meaningful exploration relationships or fitting artefacts.
The Challenge
Orogenic gold in Val-d'Or is not a simple geochemical bullseye. Mineralization follows structural grain: shear zones, high-strain domains, lithological boundaries, and second- or third-order faults plays off the Cadillac-Larder Lake deformation zone. A prospectivity model needs to learn that structural architecture, not just proximity to assay points.
The additional challenge: can a model trained on one part of the district carry that structural signature into ground it has never seen?
The test design: The model was trained on a smaller eastern AOI (~2,200 km²) and evaluated across a broader Val-d'Or AOI (~6,600 km²), three times the training area. The result isnot a fit metric; it is a transfer test.
What We Built
The project integrates 20 datasets across five evidence layers, built from public SIGEOM geology, geophysics, geochemistry, and satellite imagery:
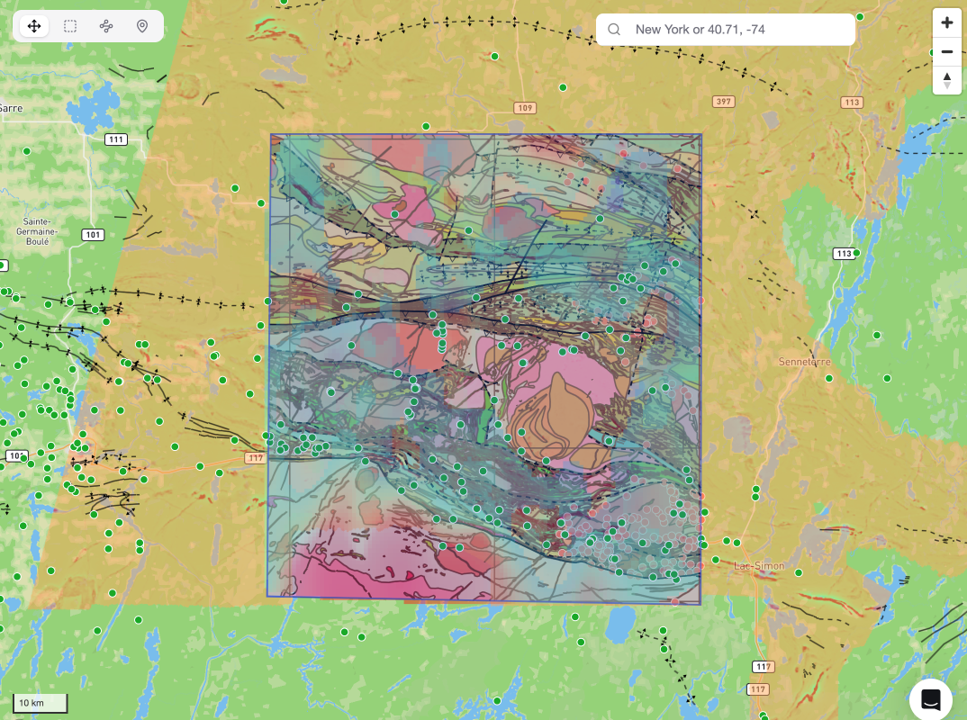
A key platform contribution here is feature engineering. Rather than rasterizing fault traces as single-pixel lines, the platform converts faults into distance and density features, communicating broader structural influence to the model. The difference between 'a fault exists here' and 'this area sits inside a structurally influenced corridor' is the difference between a weak and a strong model input for an orogenic gold system.
What the Model Found
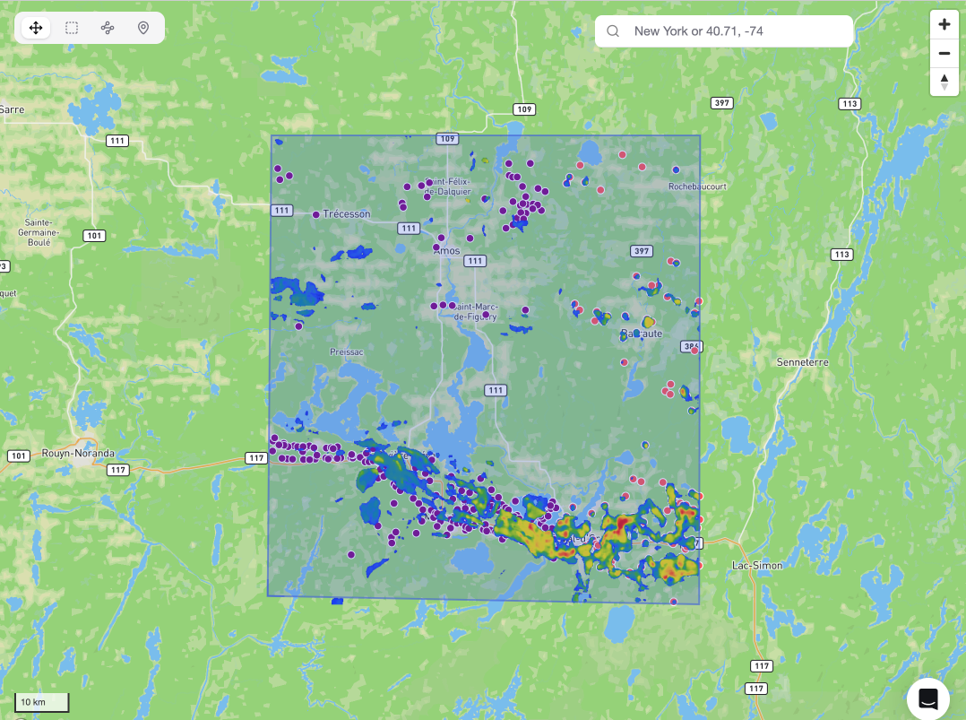
The prospectivity surface does not produceisolated bullseyes around scattered assay points. It lights up acorridor-shaped pattern consistent with the fault- and shear-controlled goldarchitecture of the district, exactly the structural expression a Val-d'Orgeologist would expect.
In the broader 6,600 km² test area, thethresholded high-prospectivity surface captures:
• 246 of 433 Au-positive mineralized body targets
• 150 fault/shear-coded targets
• 47 mine and deposit records
The captured set spans a meaningfulcross-section of the district:
• Mine Bras D'Or (Zone Dumont): fault/shear-controlled, ~1.1 Mt at6.24 g/t Au. One of the strongest sampled model responses in the test area.
• Mine Lucien C. Beliveau (New Pascalis): ~1.8 Mt at 3.17 g/t Au.Captured in both training and testing surfaces.
• Mine Goldex and Mine Lamaque / Triangle Zone: major active andhistorical Val-d'Or systems flagged inside high-prospectivity zones.
• Mine Lac Herbin, Mine Kiena, Mine Akasaba, Mine Simkar: closed orresource-bearing deposits reinforcing the structural corridor theme.
The model recovers known gold systems alongstructurally prepared ground, not one isolated anomaly, but a district-scalecorridor pattern. That is what earns confidence in the ground it flags that isnot yet drilled.
Model Performance
ROC-AUC: Micro/macro0.815 / 0.818. Average precision 0.395 / 0.406. This is the right kind of result for a regional prioritization screen: a ranking surface that enriches known mineralization into the higher-prospectivity portion of the landscape.
Feature importance confirms the model is learning the right exploration signals for a Val-d'Or orogenic gold system:
The top four features (electromagnetics, stratigraphy, positive-Au geochemistry, and magnetics) account for ~85% of model weighting. That ranking is geologically sensible: the EM and magnetic layers carry the regional framework, direct Au geochemistry supplies the mineralization signal, and fault buffering and spectral indices refine the structural corridors.
The Takeaway
In a single project, MinersAI organized a Val-d'Or gold prospectivity workflow from source data to model-ready evidence to validated prospectivity map, trained on 2,200 km², tested on 6,600 km², and recovering the district-scale structural control on gold that geologists have mapped for decades.
The commercial value is straightforward:MinersAI gives the user a way to structure a complex exploration problemwithout losing traceability. The inputs, the feature engineering decisions, the model outputs, and the validation evidence stay connected in one project, so results can be reviewed, communicated, and built upon rather than re-derived from scratch.
A note on interpretation: This is a regional prioritization model, not a drill-ready resource statement. Its value is in ranking ground, surfacing structural trends, and helping a geologist decide where to spend interpretation and field time next.